Data quality score
Understand the context behind your emission estimate with Lune’s Data Quality Score (DQS). This score provides insight into the type and completeness of the data used, highlighting where assumptions may have been needed to deliver the most accurate and precise estimate possible.Pre-requisites
Familiarize yourself with the following guides:
1. Calculate an emission estimate
Each time an emissions estimate is calculated, a DQS is returned alongside it.The DQS is returned for every individual leg estimate, including:- Live and test estimates
- Estimates with
is_shipmentset to eithertrueorfalse - Resolved legs (for example, from Lune’s road transfer inference feature)
Using the API
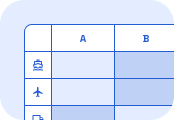
When you make aPOST request to /v1/estimates/shipping/multi-leg, the response will include several data_quality_score objects. There will be one for the entire shipment, and one for each leg. This object contains a letter grade indicating the quality of the input data for that leg.Using a CSV
When you upload a CSV to calculate emissions, the results file will include a Data Quality Score for each estimate. The following columns in the results file indicate the calculated score:overall_data_quality_scorelegx_data_quality_score2. Understanding the DQS
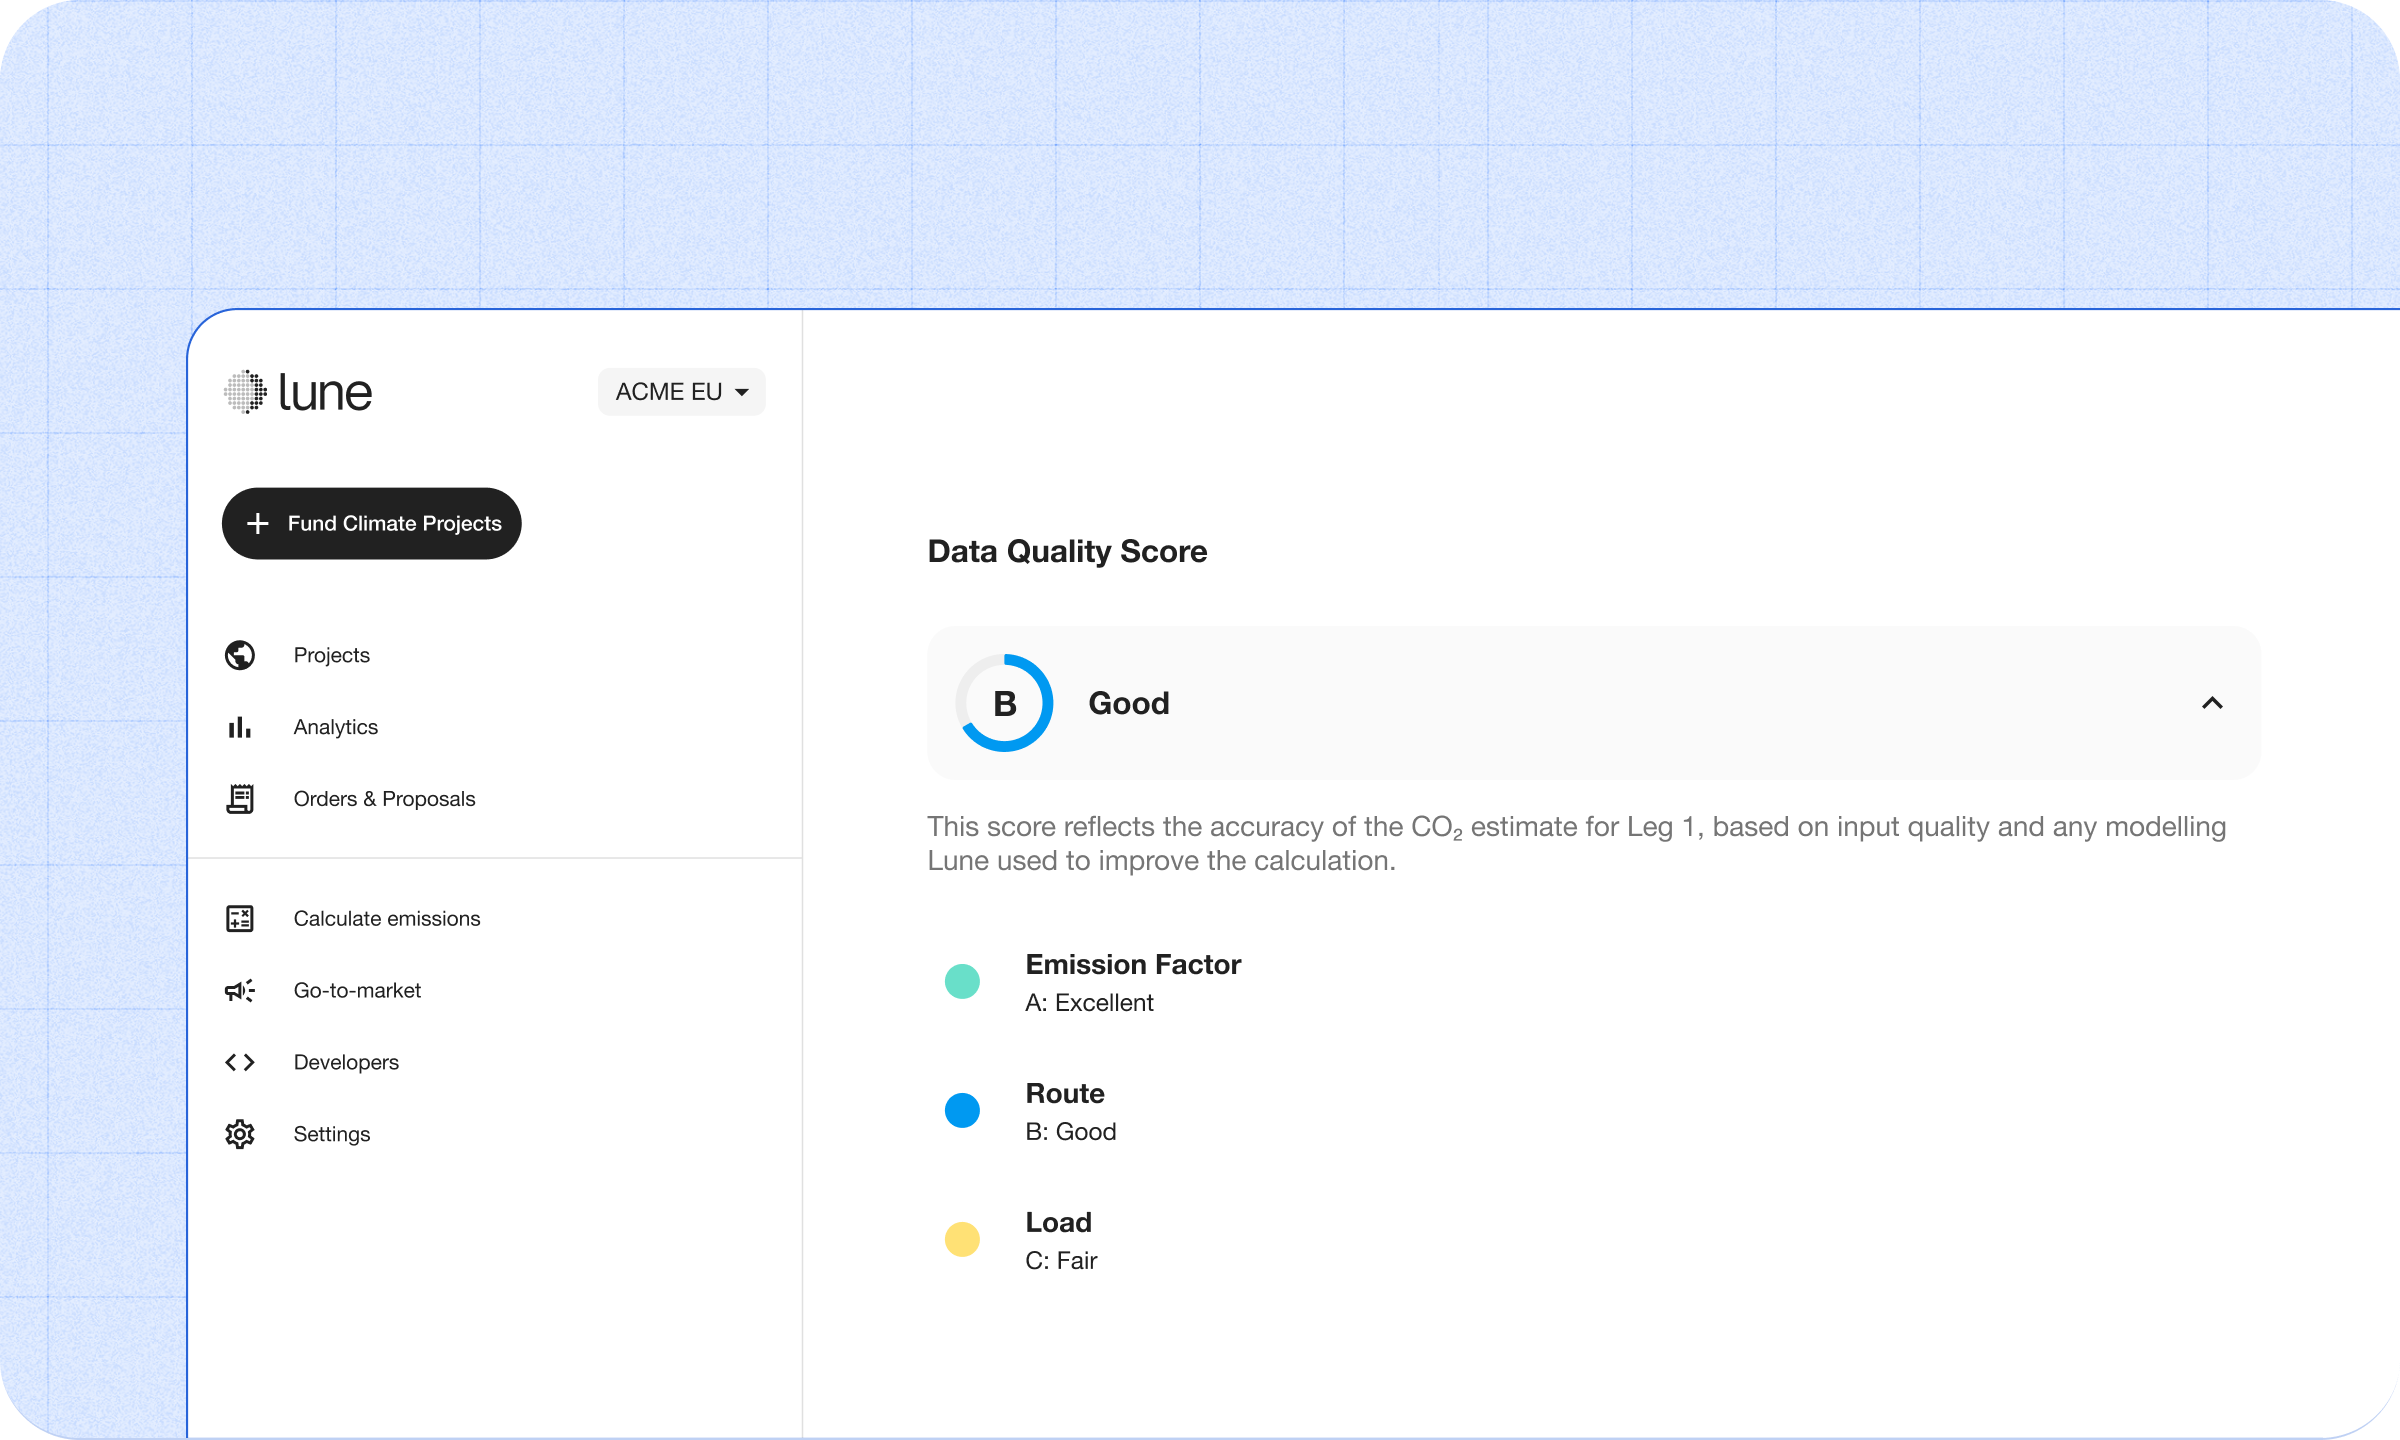
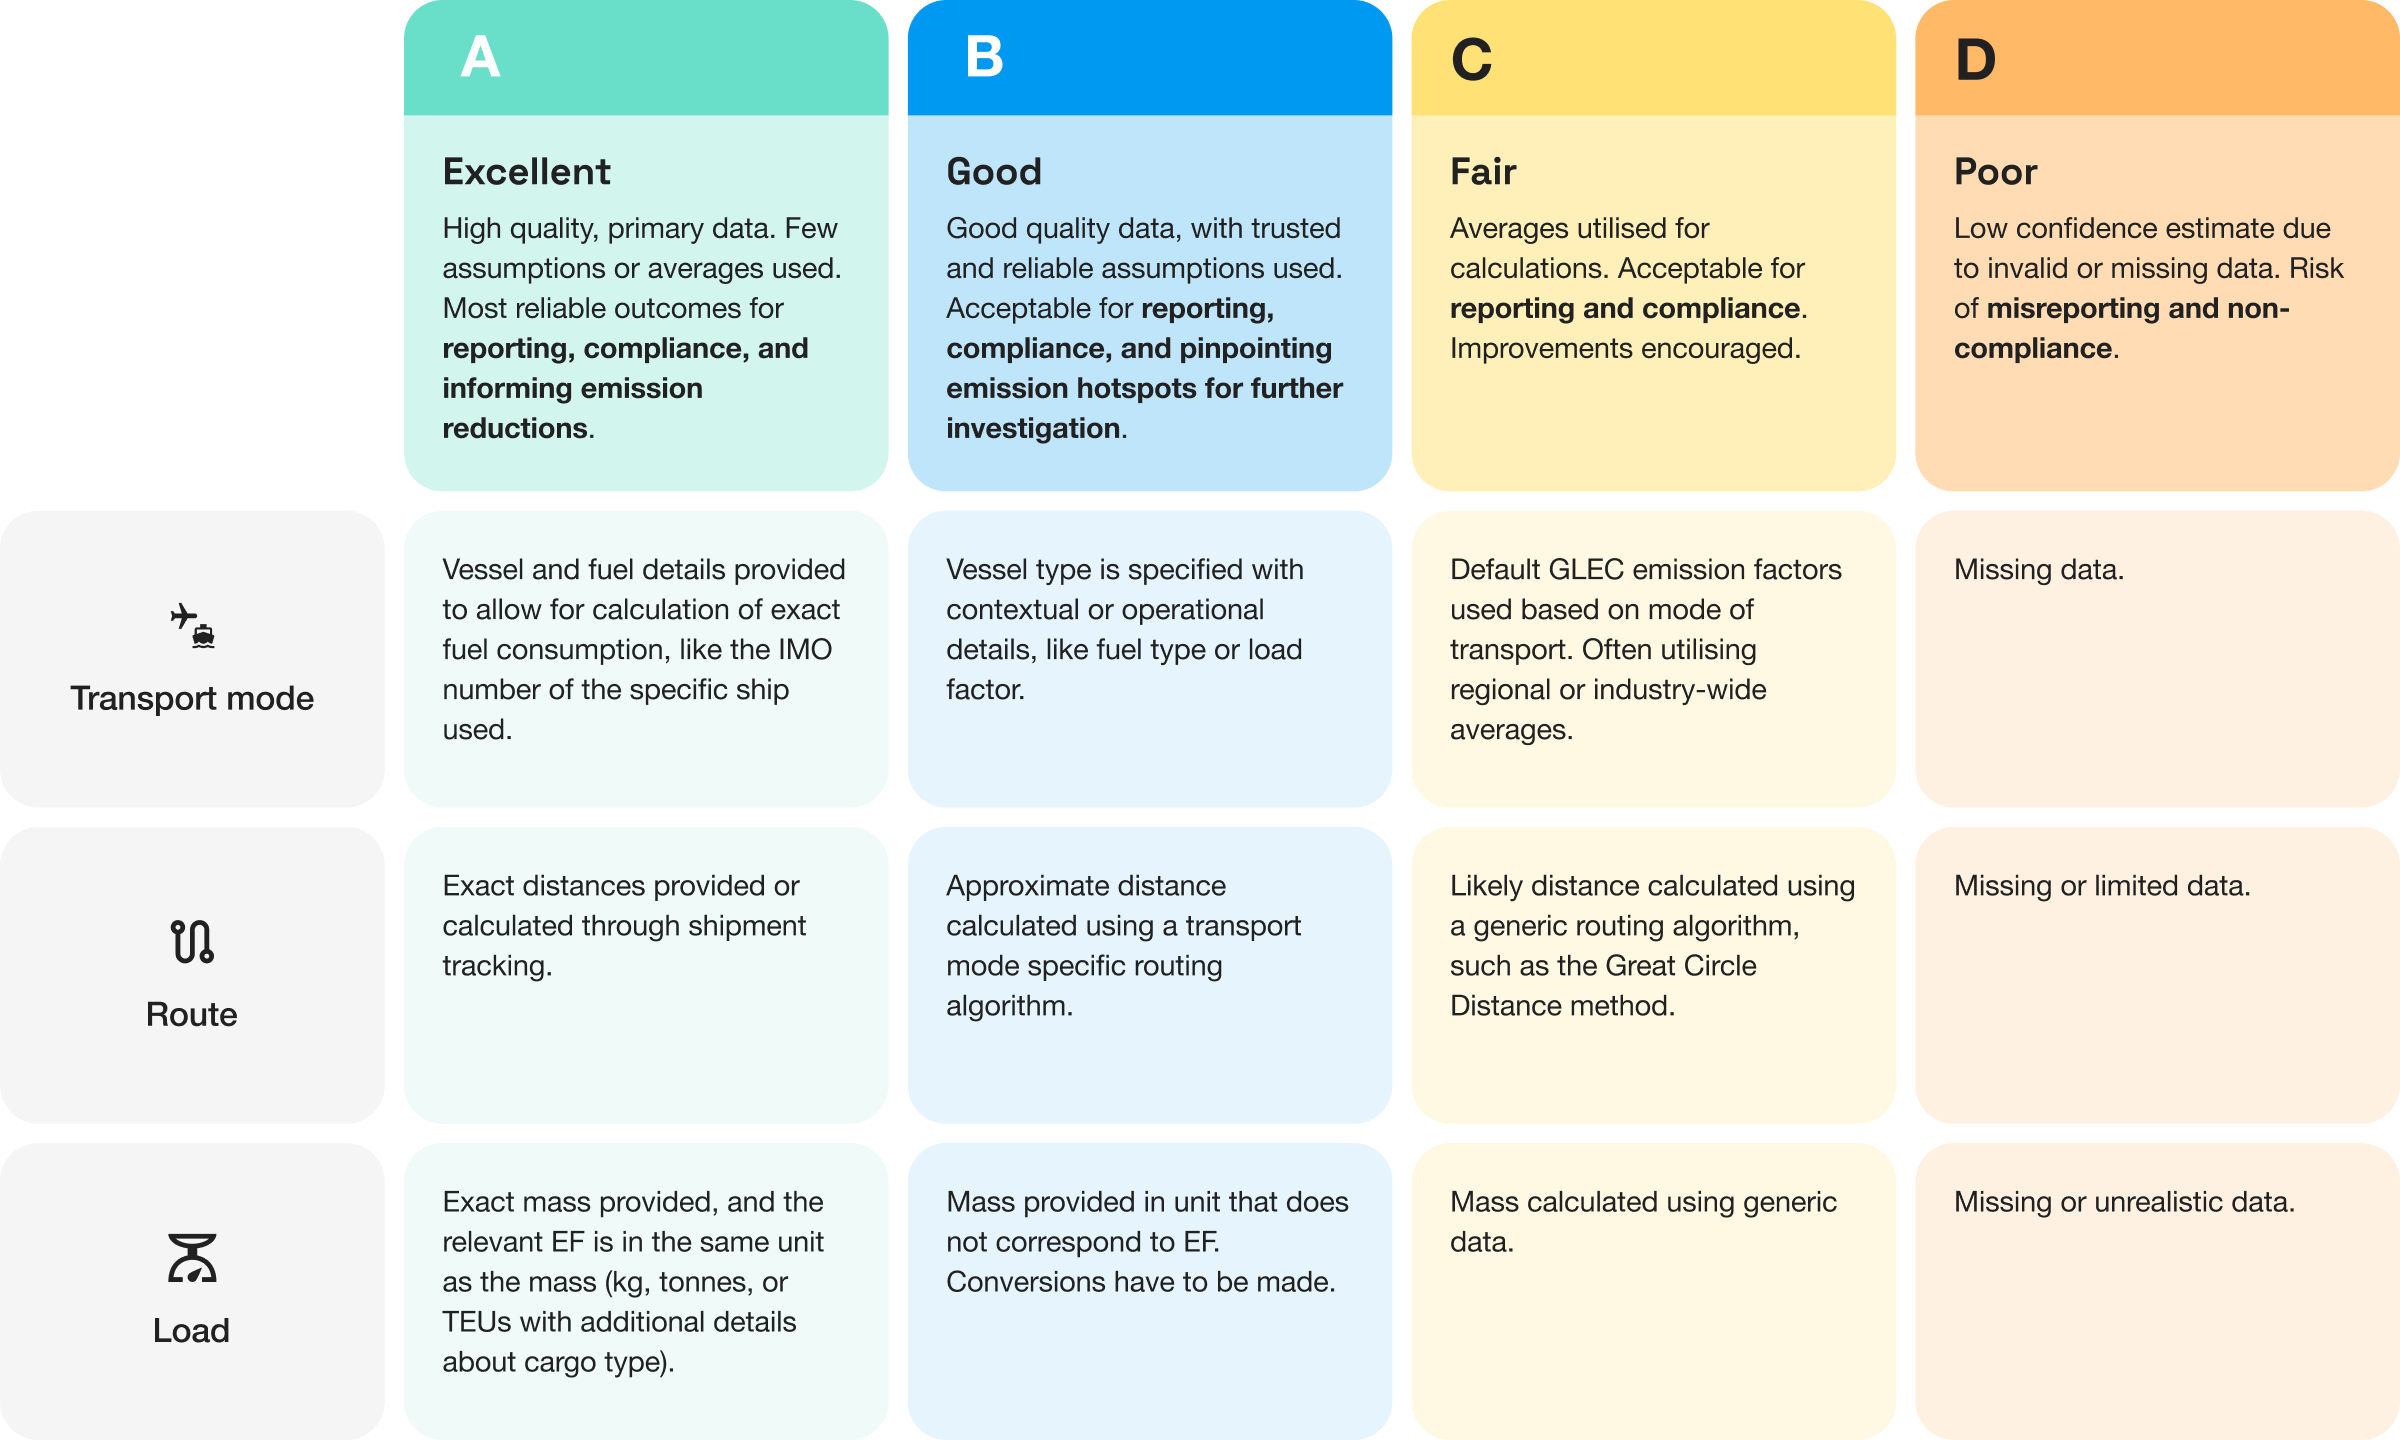
The Data Quality Score (DQS) reflects the precision of each emission estimate. Estimates based on high-quality, primary data provided directly in the request will receive higher scores. In contrast, if Lune’s emissions intelligence must rely on modelled or average emissions data to fill in missing or incomplete input, the score will trend lower.The DQS is returned as a letter grade ranging fromA to D, including plus and minus variations. A indicates excellent data quality, that can most confidently be used for reporting and compliance. D signals poor data quality, often due to low-confidence or invalid inputs, that is unacceptable for reporting and compliance.See a breakdown of each grade, and how the score is calculated is below.Calculating the DQS
Lune’s DQS builds on the Smart Freight Centre’s Data Quality Index but takes a more granular approach. The DQS goes beyond the standard framework to provide deeper insight into the quality and completeness of the data behind each estimate.The score is calculated using a weighted average of three components:- Transport method/Emission factor: Determined from the data provided and inferred about the method of transport. Makes up 45% of the total score.
- Route: Determined from the data provided and inferred about the total distance travelled. Makes up 35% of the total score.
- Load: Determined from the data provided and inferred about the total mass of the shipment. Makes up 20% of the total score.
Improving your DQS
To achieve the highest possible score for each shipment method, thus improving the accuracy of your emission estimate, aim to provide the most specific and accurate data available:- Specify the actual transport vessel:
- Air shipments: Include the flight number or aircraft type.
- Sea shipments: Provide the IMO number or ship name, along with the departure date to enable AIS tracking.
- Road shipments: Share fuel usage details. If unavailable, include values for
load_factor,empty_run_factor,gradient, orsituation.
- Provide additional details when using TEUs: When submitting estimates using TEUs, include the
massof the cargo if available. If mass is not known, specifying acargo_typecan help improve the accuracy of the estimate. - Improve route specificity:
- If the vessel isn’t being tracked, provide coordinates, full addresses, or the exact distance traveled.
- Ensure that origin and destination data are appropriate for the selected shipment method.