Logistics analytics
With Lune, you can easily share reports with your customers, enabling them to explore their shipment emissions.Pre-requisites
Complete the following setup steps before using this guide:
Generate an API key and authenticate your account.

Set up Client Accounts to track emissions for your individual customers. Ensure
external_pages_visibility is set to public.Ensure that the
is_shipment property is set to true when calculating emissions either through the API or CSV.Set the shipped_at to the date that the shipment was started on, or the date that you want the emission to be dated for. If not set, this property will default to the day the calculation was made.1. Configure your customer URL
Each customer’s report is accessible via a unique URL:https://sustainability.lune.co/logistics/<YOUR_ORG_ID>/<CUSTOMER_HANDLE>Where:<YOUR_ORG_ID>is your organisation’s ID, which remains constant. You can find this on the settings page of the Lune dashboard.<CUSTOMER_HANDLE>is the unique identifier set during client account creation, as thehandleproperty.
Tip: Embed this URL directly into your application to simplify access for customers.For test client accounts, add
test to the URL like so:https://sustainability.lune.co/logistics/test/<ORG_ID>/<HANDLE>2. Understanding the analytics page
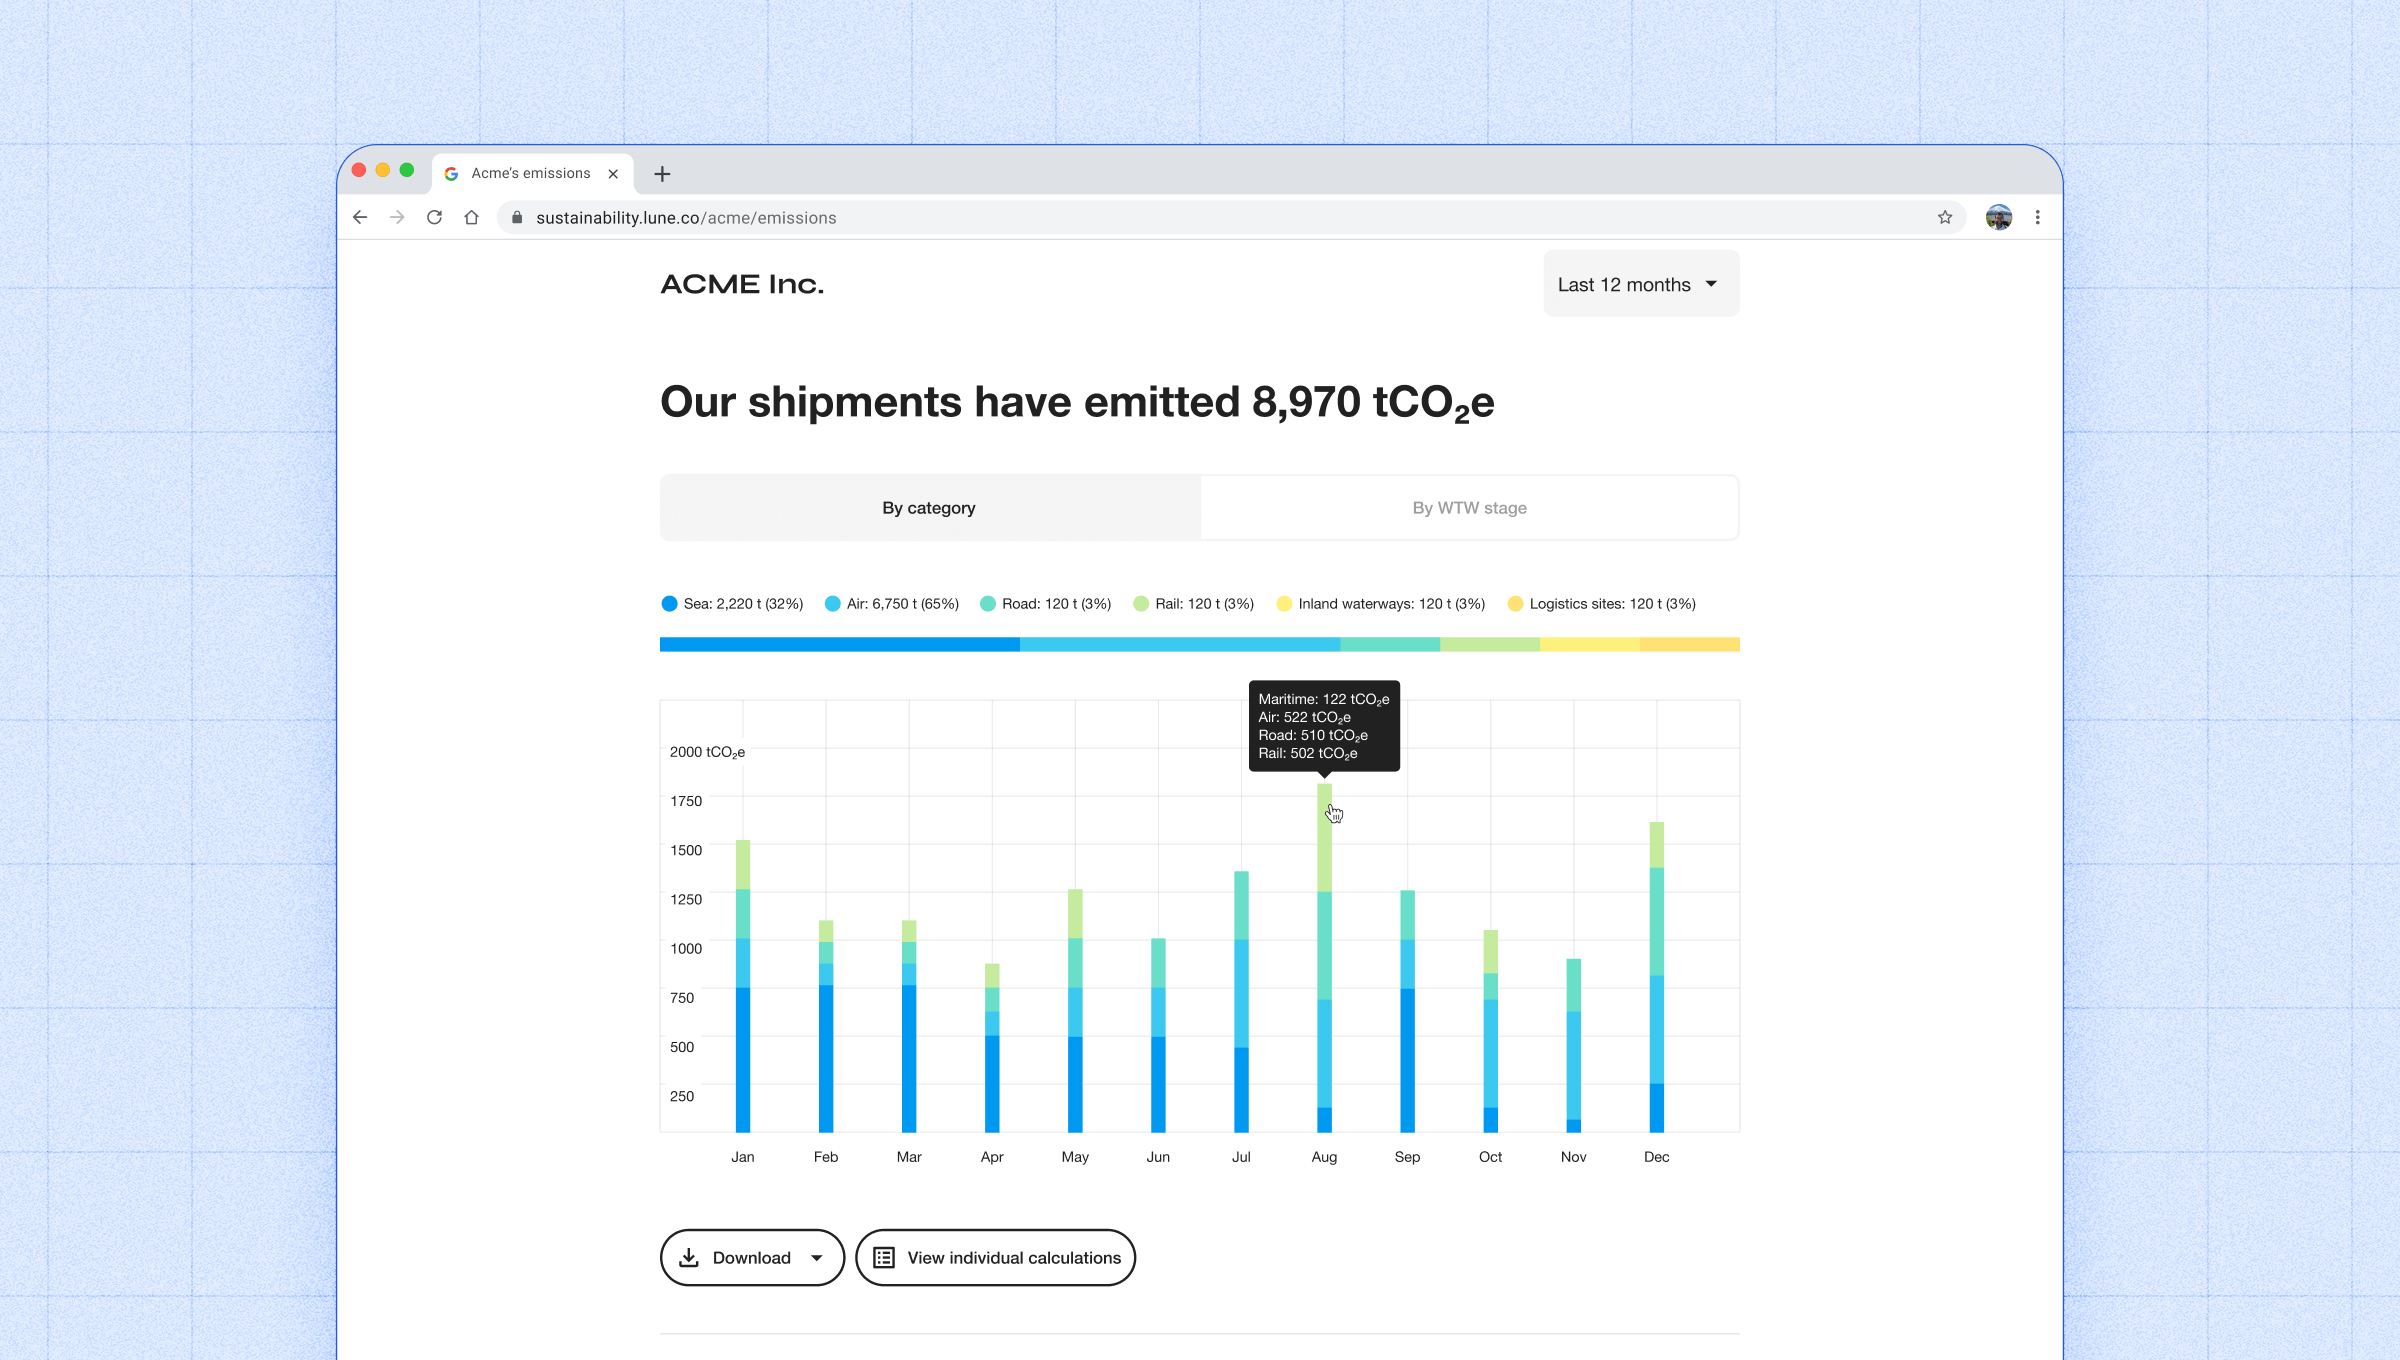
The analytics page provides comprehensive insights into your customers' emissions data. At a glance, customers can see the total tCO₂e calculated for their shipments, displayed prominently at the top of the page.Visualise emissions data
Interactive graphs help customers explore their emissions in detail, with options to download each graph as a CSV or image. Key graphs include:- Total emissions calculated: Displays a breakdown by shipment method.
- Carbon intensity: Indicates how polluting the transportation of goods has been month over month. Learn more about carbon intensity.

Individual calculations
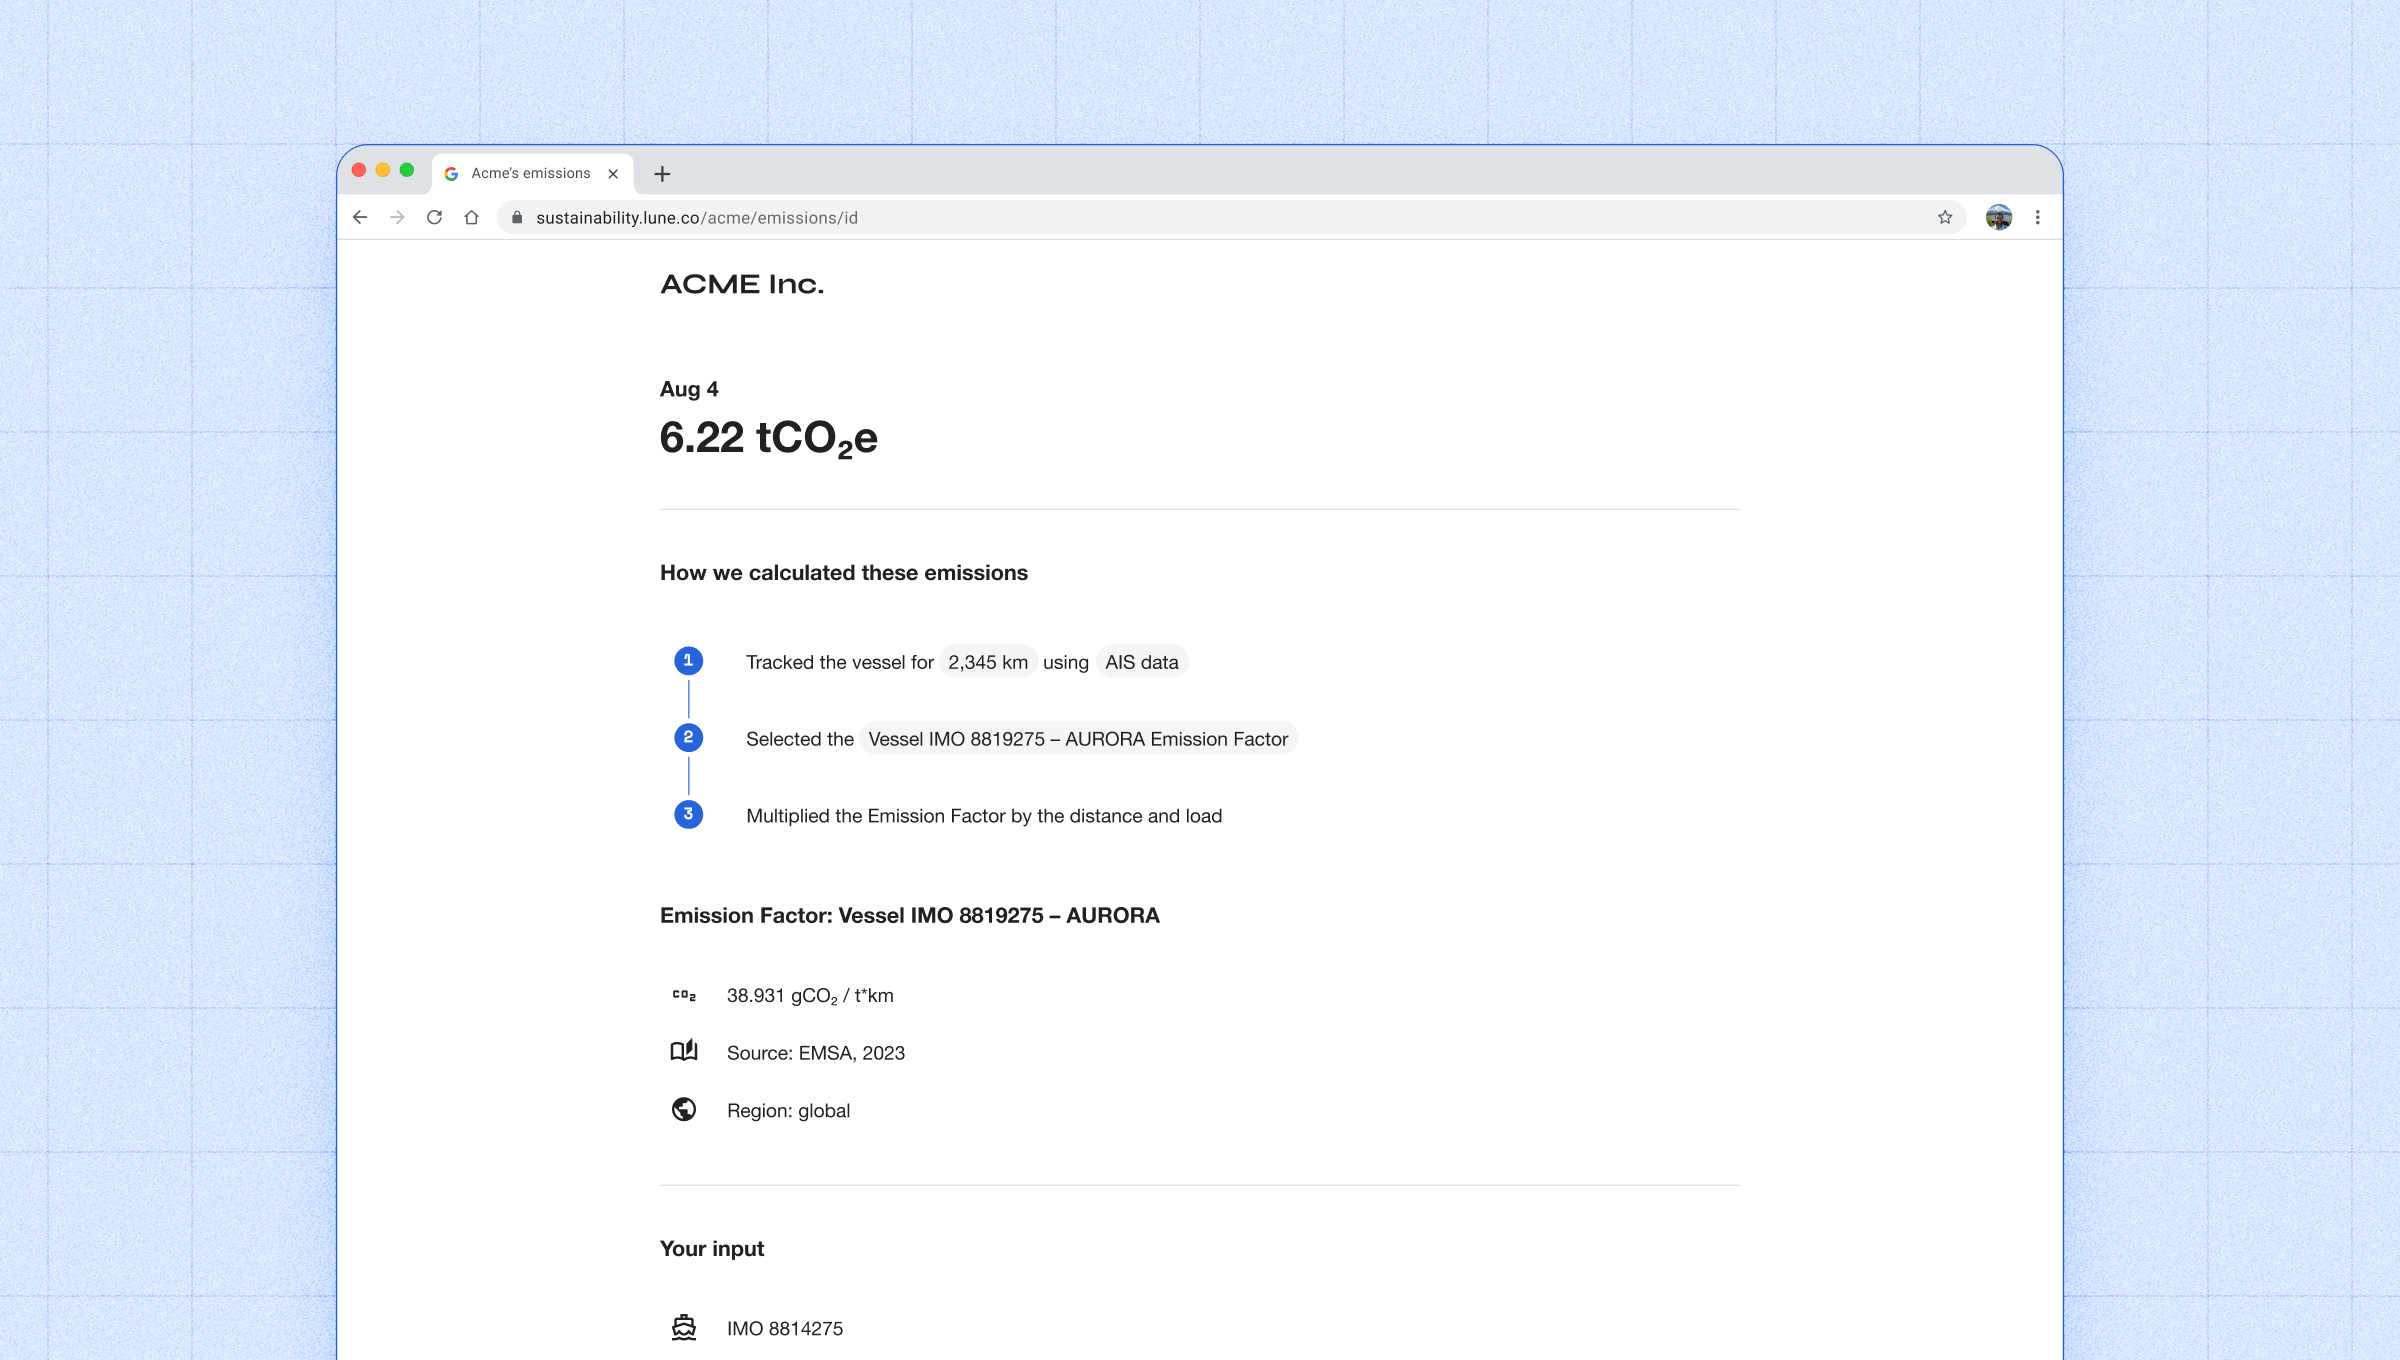
Beneath the total emissions graph, customers can click View individual calculations to access detailed data for each shipment. For each calculation, customers can find:- A step-by-step explanation of the calculation process.
- A breakdown of the emission factor used, including its source.
- Details of the input properties used to generate the estimate.

FAQ section
At the bottom of the page, a helpful FAQ answers common questions about logistics emissions calculations, empowering customers with the knowledge they need.What to do next…
Troubleshooting
Having issues generating the URL? Verify your organisation ID and customer account handle for accuracy. Ensure theexternal_pages_visibility setting is configured to public.Missing shipment data? Confirm that the is_shipment parameter is set to true for all shipments. To update this property for previously calculated shipments, use the annotation update endpoint endpoint.Individual calculations should appear instantly, but graphs may have a lag.For further assistance, contact our support team.